
In an enterprise, lots of machines to manage, it is a common question (probably not common enough) to ask if my devices are patched, up to date and therefore more secure than if I just leave them to their own devices.
The good news is that reports that show the state of all your machines are built into Microsoft 365 and the documentation is found at https://learn.microsoft.com/en-gb/windows/deployment/update/wufb-reports-overview. This blog post will summarise the needed settings and show you what to expect.
Step 1: Create a new Azure Log Analytics subscription (or select an existing one). Your Windows Update for Business Reports data that Microsoft 365 shows you is stored here.
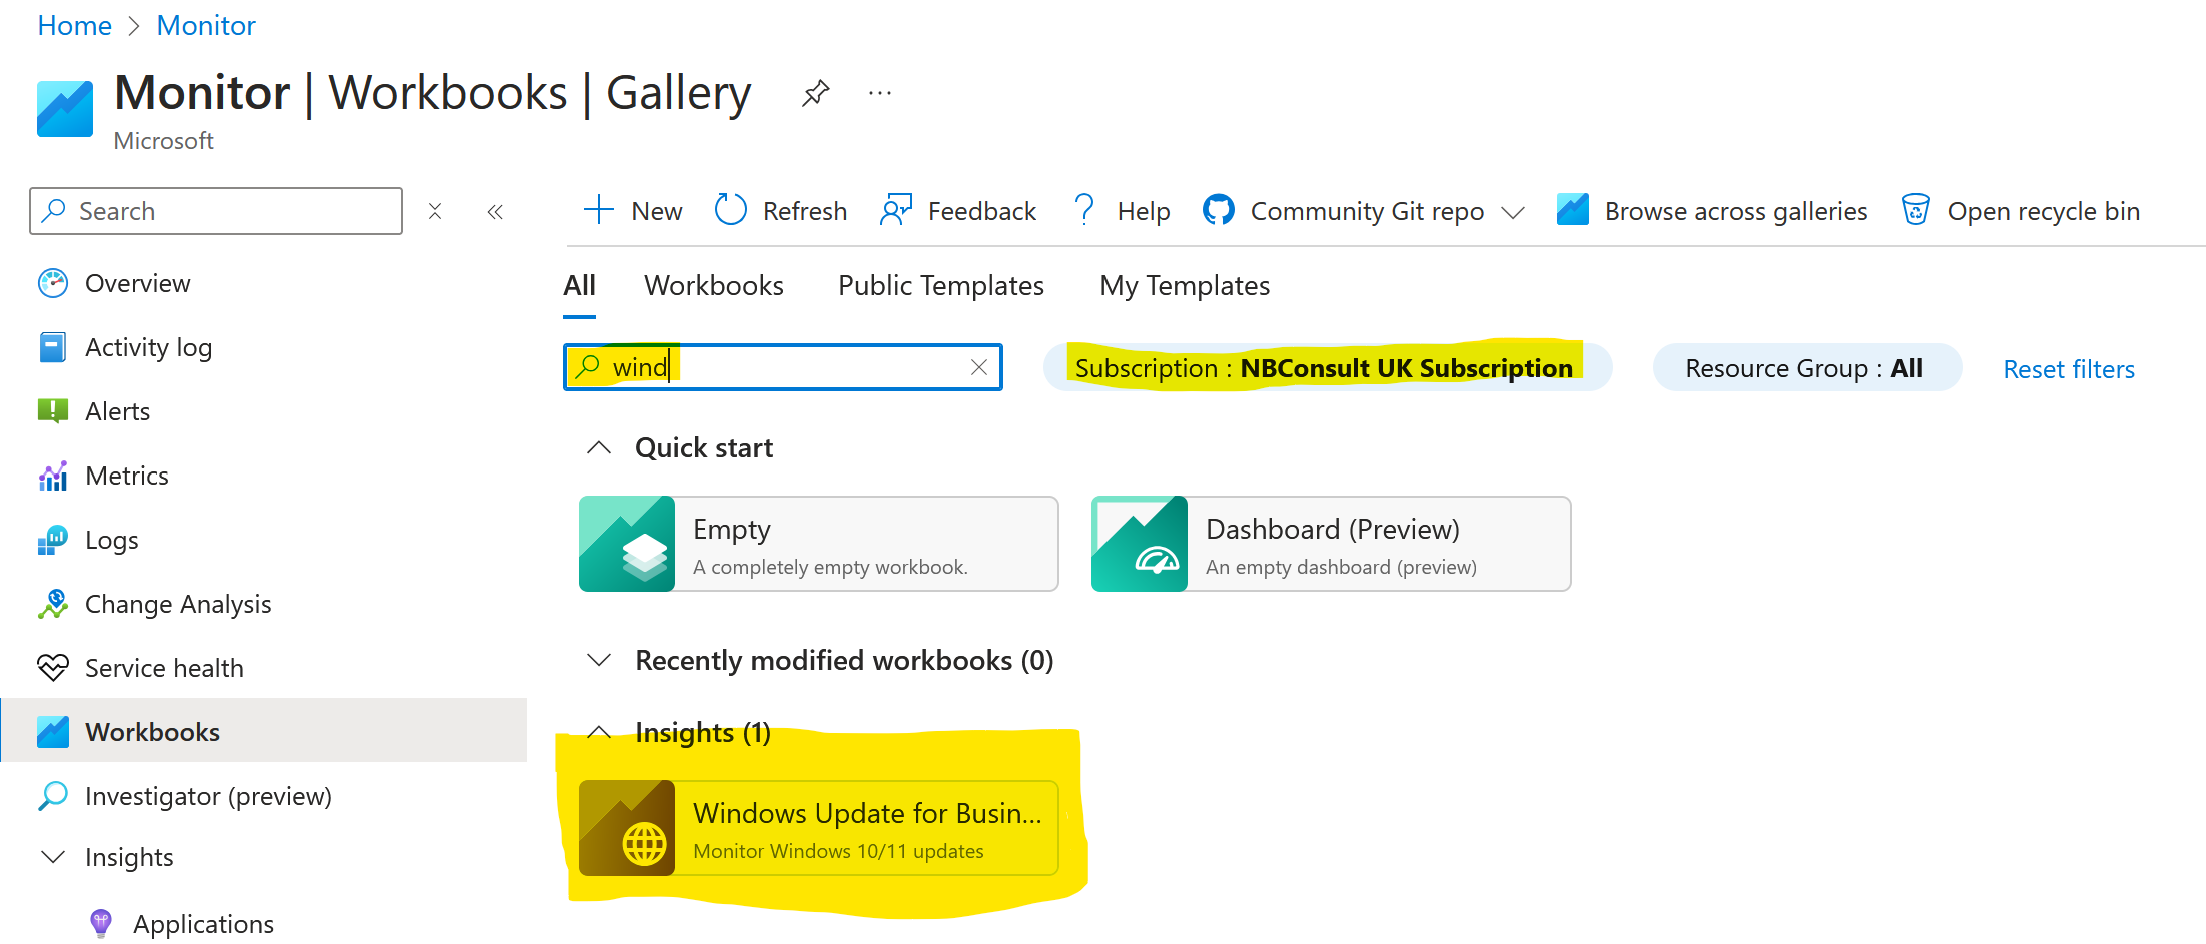
Step 2: Enrol into Windows Updates for Business Reports through Azure Monitor. For this, from the Azure Portal (https://portal.azure.com) search for Monitor and then click Workbooks from the left menu. Open the “Windows Update for Business reports” workbook (its typically the last one on the page, or start typing “Windows” to filter the list. From inside the workbook select the subscription and then workspace that you created in step 1. If you already had a Log Analytics Workspace and did not make a new one, select that one here. Make sure that the Azure portal is showing the subscription that contains your Log Analytics Workspace if you have more than one subscription:
Scroll down and click Get Started:
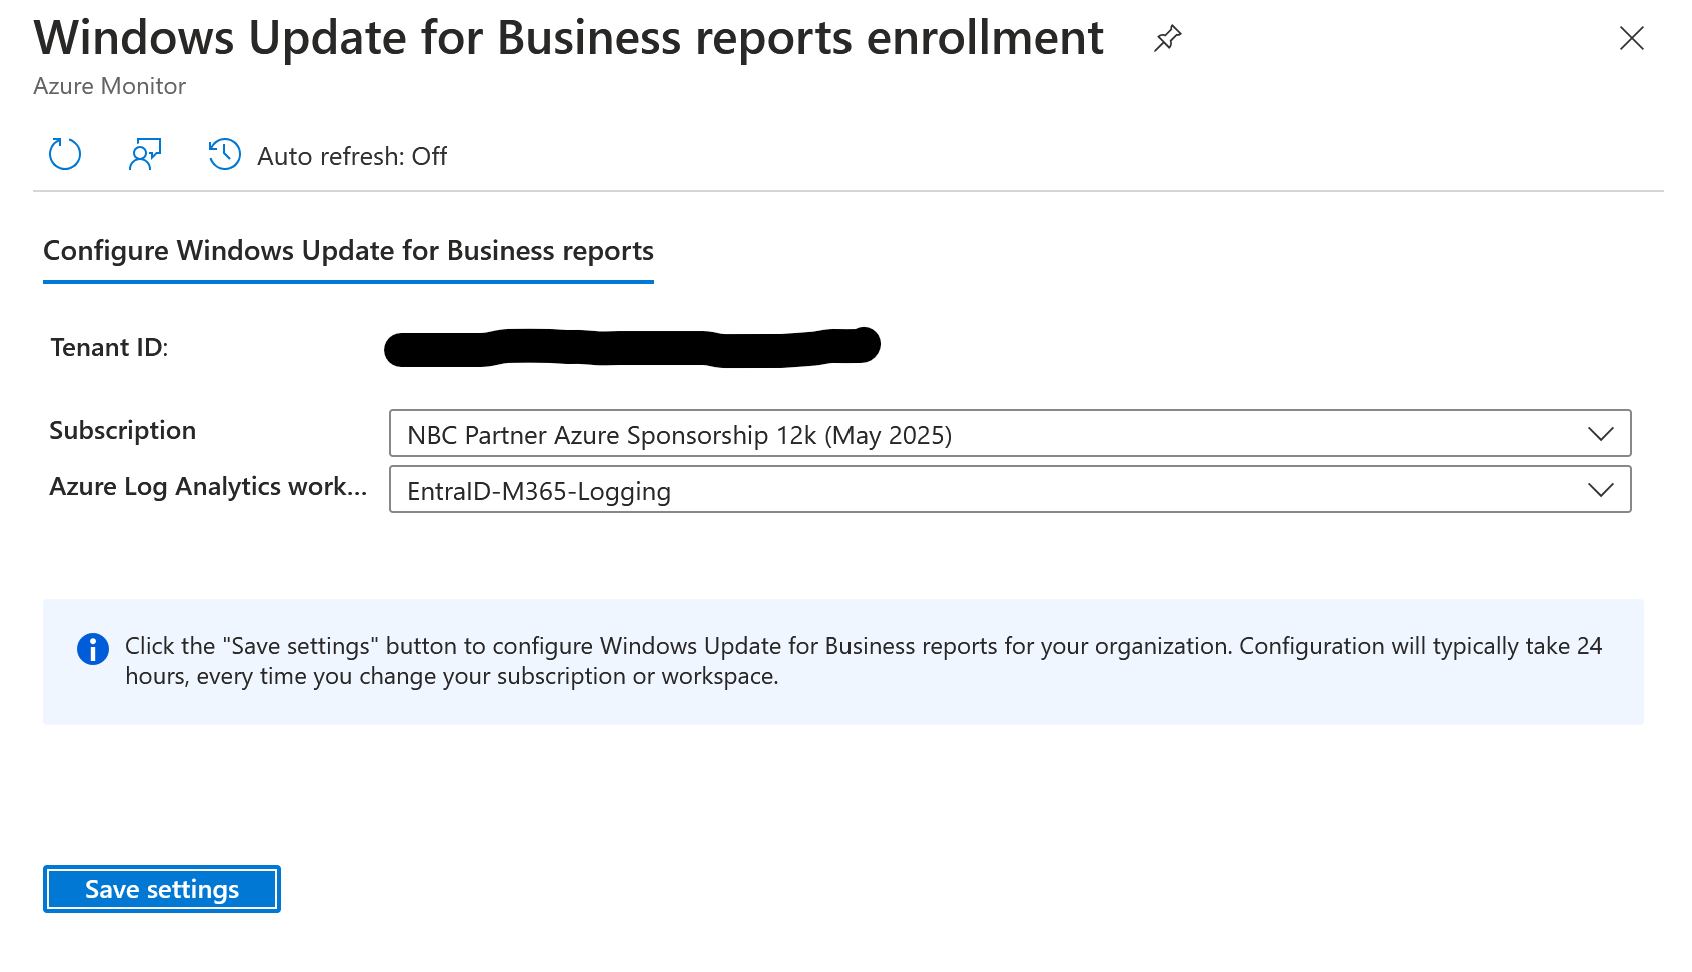
Click Save Settings, then Save and then refresh the page to see any data.
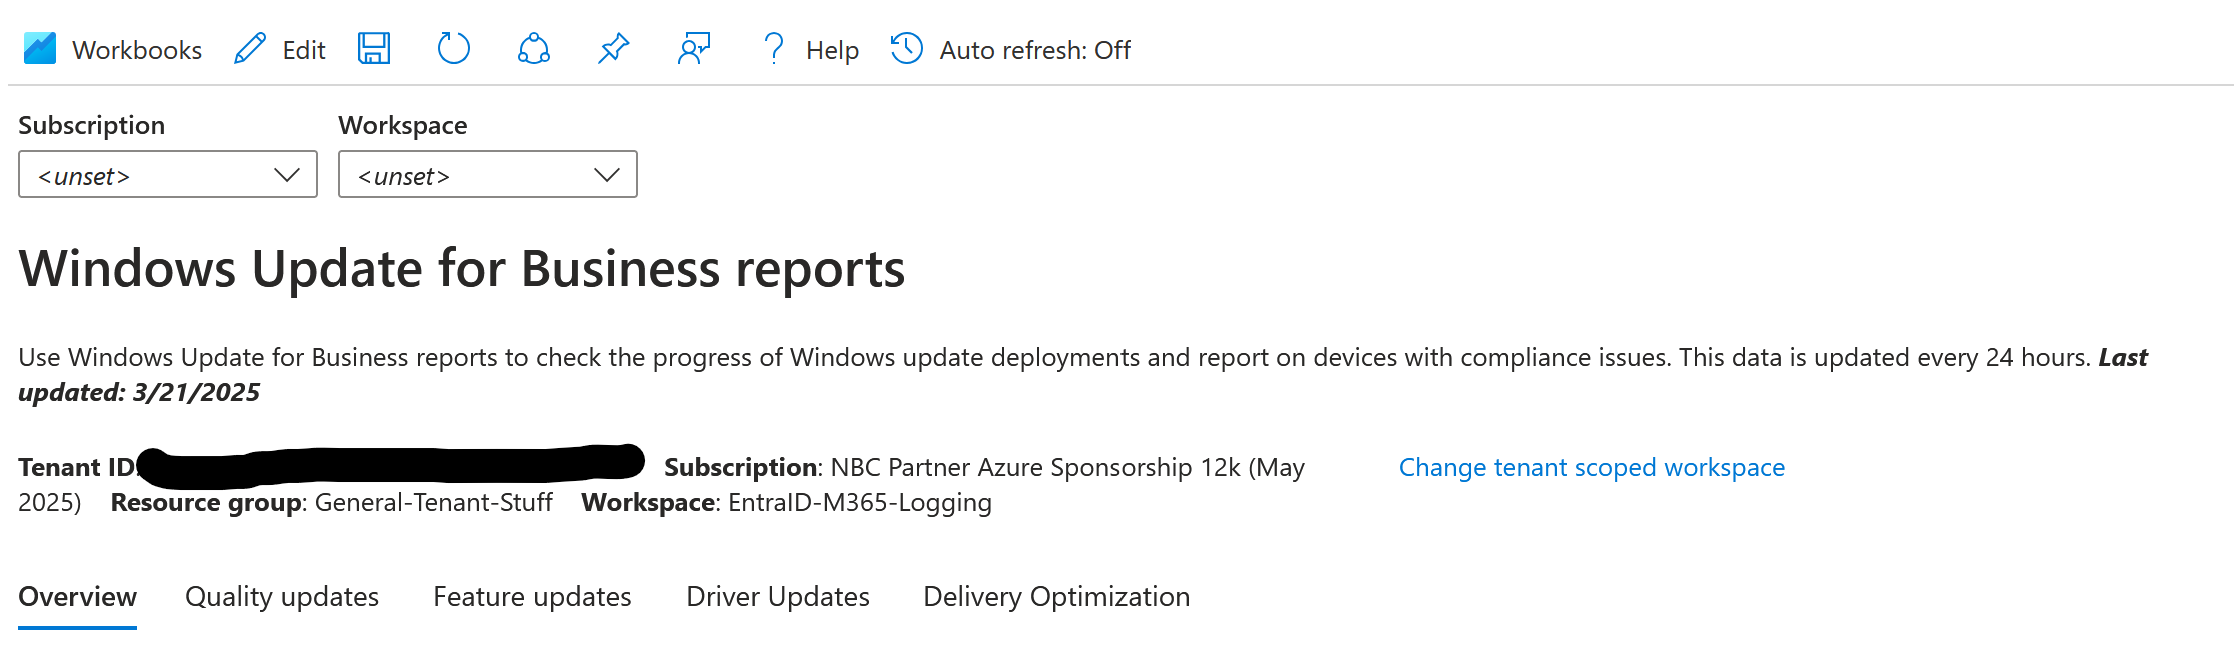
Note that a new workspace will not have any data in it to show in the reports. This data should start to appear in the workspace (tables starting with the name UC… will appear) within 24 hours of configuring your clients to send the required data.
The report shows the day it was last updated and this should always be within a day or two once the initial configuration is done and data is being sent. Devices that are active and connected to the internet daily can expect to be fully uploaded within one week (usually less than 72 hours). Devices that are less active can take up to two weeks before data is fully available.
Step 3: Configure clients to report their data to Log Analytics. This blog will look at using Intune to do this, but there is also a manual method and a script you can run on each device. These other two options are found at https://learn.microsoft.com/en-gb/windows/deployment/update/wufb-reports-enable#next-steps.
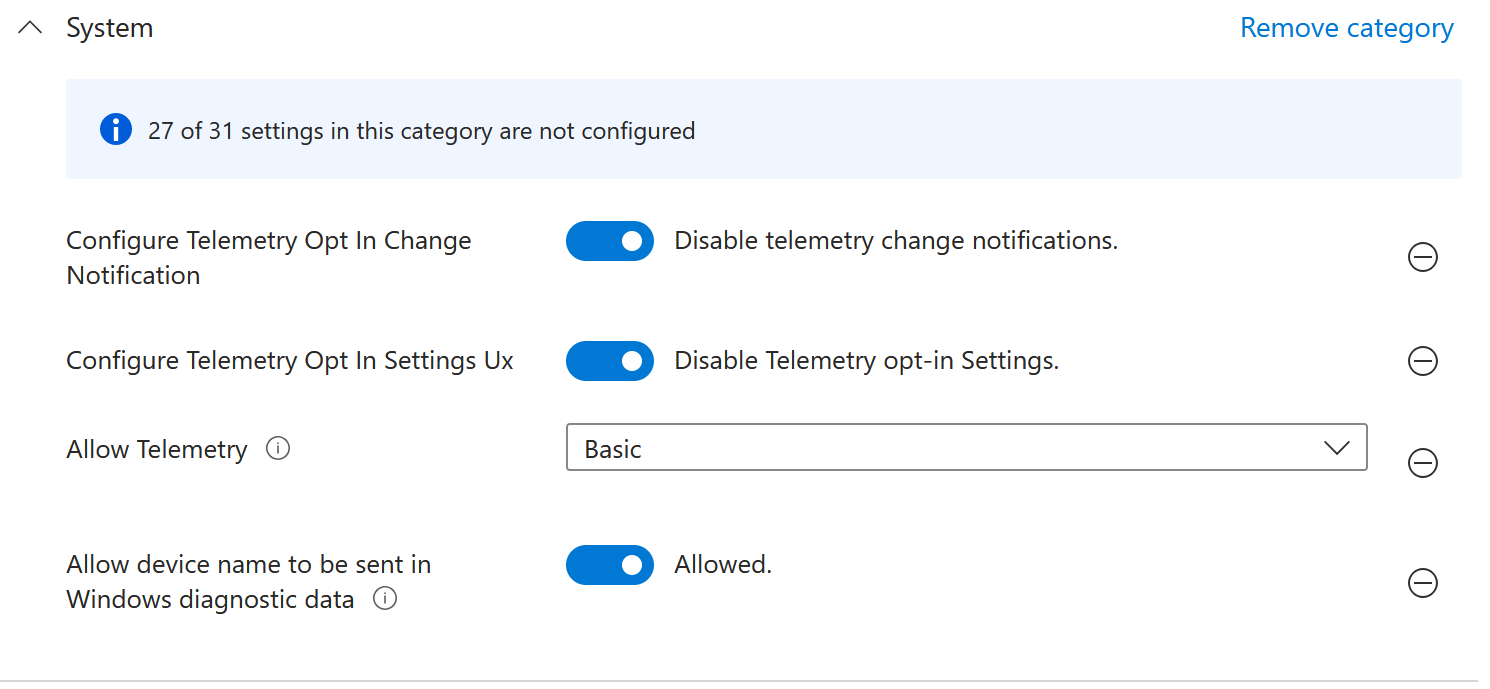
In Intune create a new Windows Configuration Policy, based on the Settings Catalog. I’ve named my policy “Windows 10 | All Devices | Windows Update for Business Reporting”, and add the following System settings:
- System/All Telemetry: Basic (to collect the data you need) (or “Full” if you need more data for your own additional workbooks)
- System/Configure Telemetry Opt In Settings Ux: Disabled (so end users cannot change your configuration on their devices)
- System\Configure Telemetry Opt In Change Notification: Disabled (so users are not notified that you are collecting telemetry)
- System\Allow device name to be sent in Windows diagnostic data: Allowed (so your reports show the device name in them and not just the Device ID).
Finish your settings by assigning this policy to All Users and All Devices.
Final Step: Use the Windows Update for Business Reports. From the M365 Admin Portal (https://admin.microsoft.com) > Health > Software Updates > Windows you can see two summary reports, the “unsupported operating systems” report (shown) and the devices that are “reaching the end of servicing”:
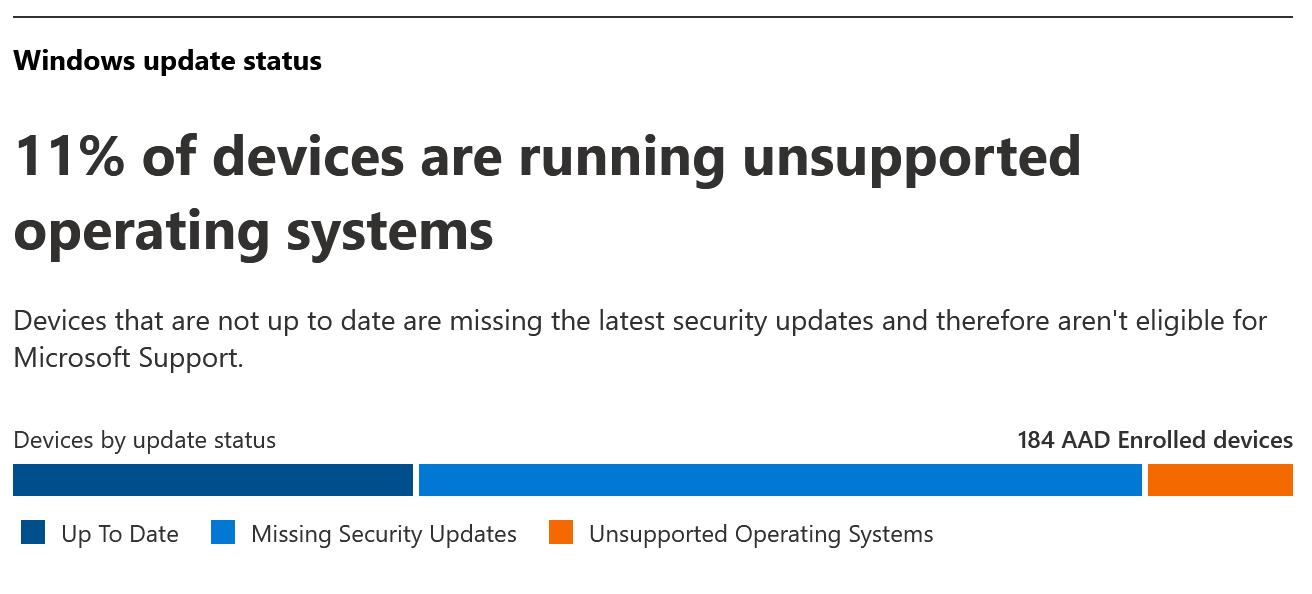
As you can see, this tenant needs to do some work with regards to device patching and feature updates!
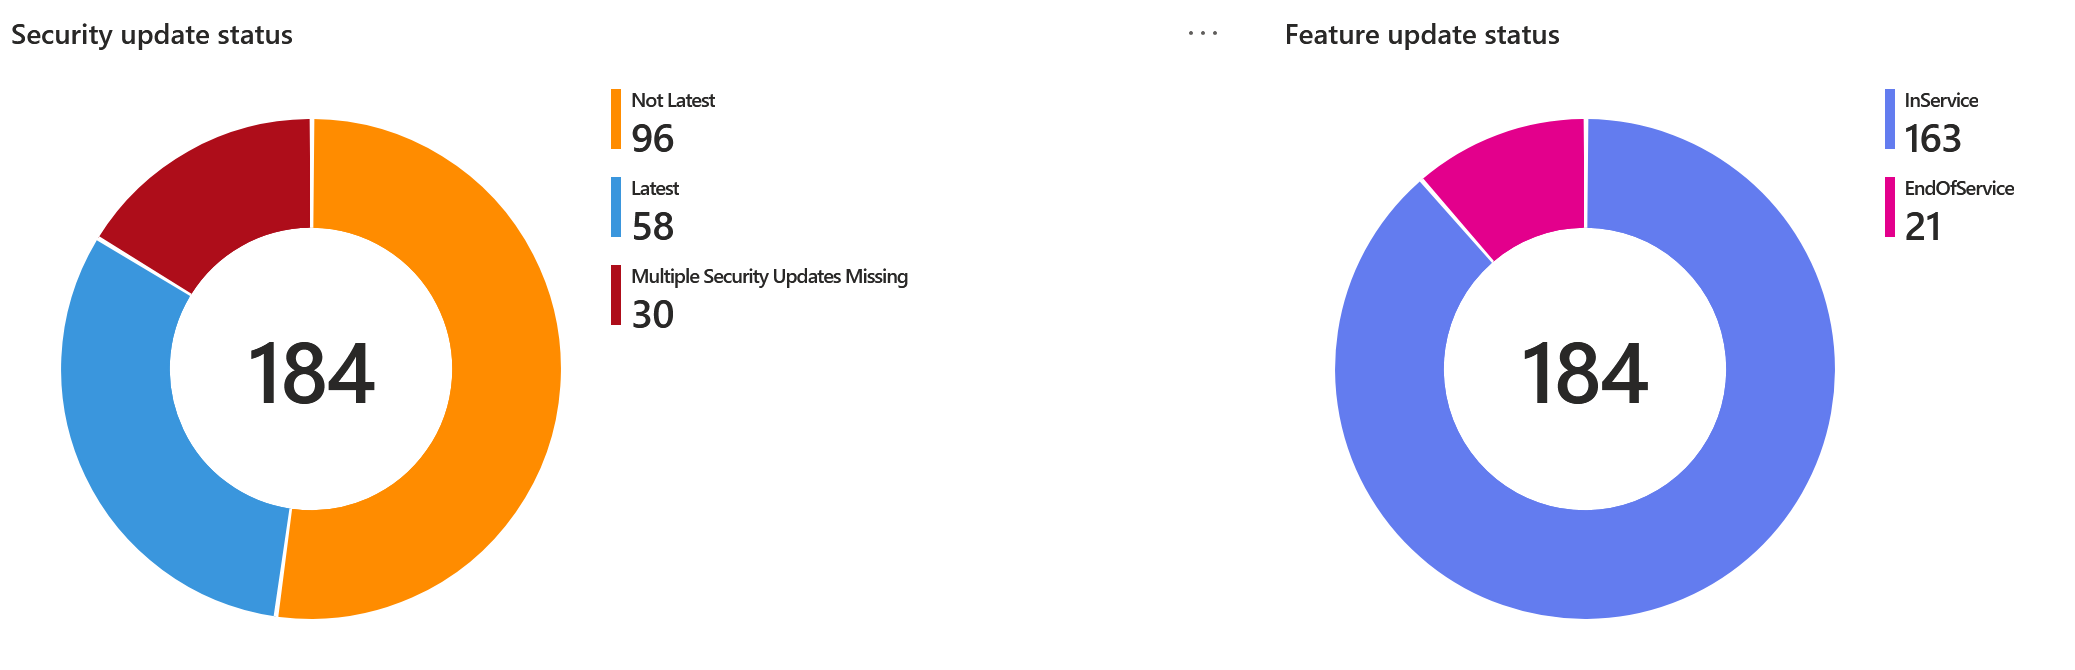
Then for more details, click the Go to Windows Update for Business Reports button. Here you will see information such as Security Update Status (shown, and found in the “Overview” section)
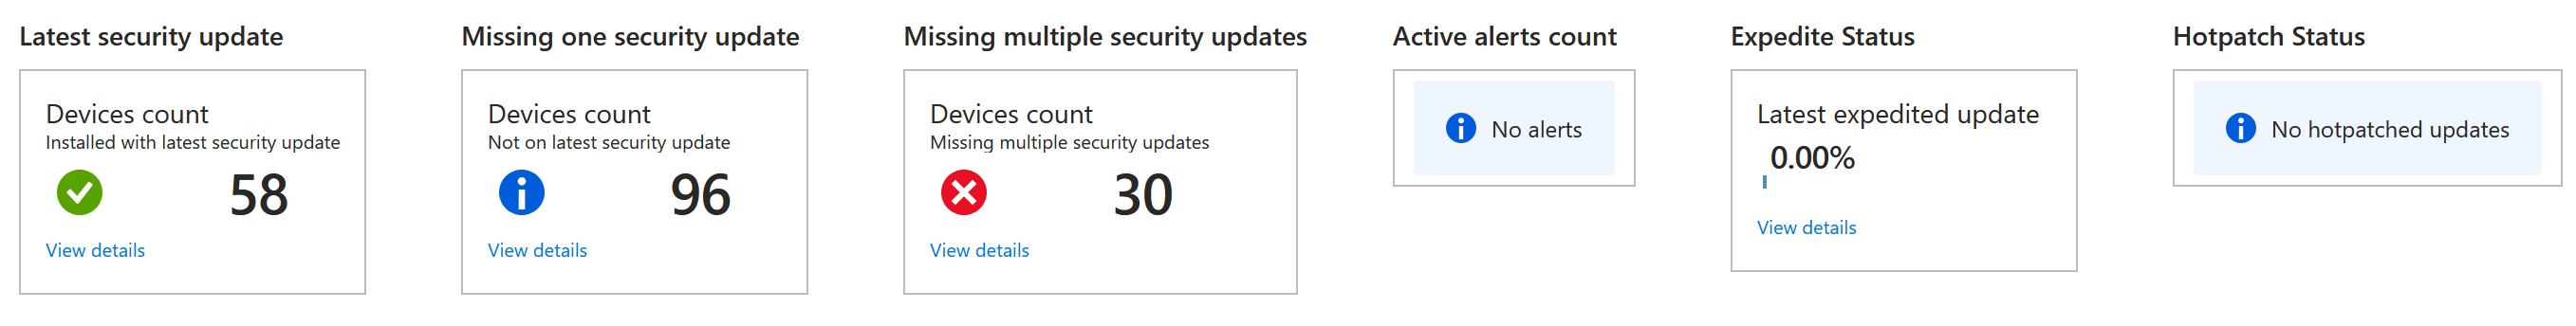
And in the “Quality Updates” section, a report on the number of devices that are a) up to date, b) missing one update, and c) missing more than one update. Emergency (or expedited) updates and hotpatch status is also shown:
The last report I am going to call out, as most are self-explanatory, is the Delivery Optimization report. This shows how much bandwidth updates have used, along with the percentage of bandwidth that has been saved due to sharing the updates around the local LAN (peering) – this is what the Delivery Optimization settings (called “DO”) in Intune do. In the below picture we can see a 21.71% bandwidth saving.
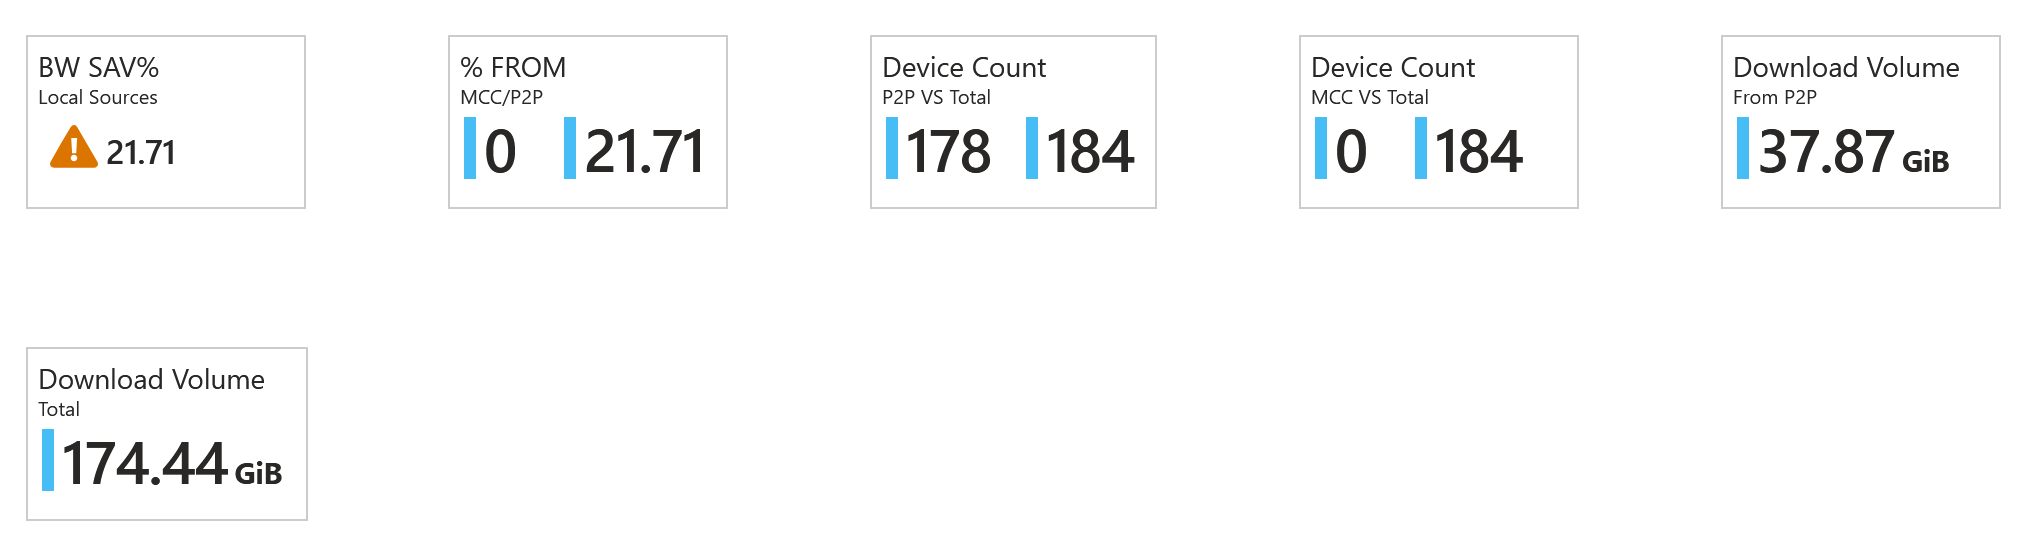
Photo by Miguel Á. Padriñán: https://www.pexels.com/photo/close-up-shot-of-keyboard-buttons-2882550/
Leave a Reply