On the internet there are a number of resources for collecting the raw data needed to size Exchange Server deployments. These include:
- http://blogs.technet.com/b/neiljohn/archive/2011/08/09/user-profile-analysis-for-exchange-server-2010.aspx (Neil Johnson – User Profile Analysis for Exchange Server 2010 )
- http://gallery.technet.microsoft.com/scriptcenter/bb94b422-eb9e-4c53-a454-f7da6ddfb5d6 (“mjolinor” – the primary source of the script used here)
This blog outlines my process for collecting the data needed for the average message size. What is missing from the above two posts is the ability to collect this data in one go for the last seven (or so days) and then get the message tracking log average over the busiest five or so days. Different countries have different working patterns and public holidays, and the scripts above only do the previous day (though Neil’s says the script uses averages across many days – it does not).
The Script
Download the script from the source and save to Notepad. Edit the top of the script by deleting the first five lines of the code (not the comments or the blank lines) and then replace them with the alternative lines shown below:
Remove These Lines
$today = get-date
$rundate = $($today.adddays(-1)).toshortdatestring()
$outfile_date = ([datetime]$rundate).tostring("yyyy_MM_dd")
$outfile = "email_stats_" + $outfile_date + ".csv"
Replace With These Lines
$today = get-date
$whichDay = $args[0]
if (! $whichDay) { $whichDay = 1 }
$rundate = $($today.adddays(-$whichDay))
$outfile_date = ([datetime]$rundate).tostring("yyyy_MM_dd")
$outfile = "email_stats_" + $outfile_date + ".csv"
Before running this script you need to do two things. First if you have different Exchange Server locations around the world you need to alter the script to only include the servers in those geographies that you want to search. Do this by changing the two lines that read as follows and add in the server name or a unique differentiator that will pick up just the mailbox and hub transport servers in these regions. Edge servers do not need to be considered:
- $mbx_servers = Get-ExchangeServer |? {$_.serverrole -match “Mailbox”}|% {$_.fqdn}
- $hts = get-exchangeserver |? {$_.serverrole -match “hubtransport”} |% {$_.name}
These two lines are near the top and need to be changed to something like the following:
- $mbx_servers = Get-ExchangeServer UK* |? {$_.serverrole -match “Mailbox”}|% {$_.fqdn}
- $hts = get-exchangeserver UK* |? {$_.serverrole -match “hubtransport”} |% {$_.name}
In the above I altered the script to find just the Exchange Servers starting with the letters UK. Adjust as needed. If you have one location/timezone worldwide then these changes are not needed.
If you are collecting data from an Exchange 2013 server(s) then change “hubtransport” in the $hts line to read “mailbox”.
Save the file as a PowerShell script (Get-MessageTrackingLogStats.ps1) and copy it to your Exchange Server.
Before you can run the script you need to check that you have enough tracking logs to process, or you will get invalid and skewed data. Run Get-TransportServer | FL name,*trackinglog* and make sure that you have a large enough quota for each day of logs and then check each of these folders and make sure they do not exceed this value. If they do, then you need to run the below script frequently before the log files are removed from the server rather than at the end of 7 or 14 days.
Now you can run the script with a number after it for how many days back you want to look at the logs. This will process the message tracking logs for that day, that number of days back. For example is you run the script Get-MessageTrackingLogStats.ps1 5 then it will look back for one day of data, five days ago. Repeat the running of the script until you have run it seven times. You will have one CSV file of tracking log reports for each of the last seven days:
- Get-MessageTrackingLogStats.ps1 1
- Get-MessageTrackingLogStats.ps1 2
- Get-MessageTrackingLogStats.ps1 3
- Get-MessageTrackingLogStats.ps1 4
- Get-MessageTrackingLogStats.ps1 5
- Get-MessageTrackingLogStats.ps1 6
- Get-MessageTrackingLogStats.ps1 7
Zip up these files and take them to a computer running Microsoft Excel.
One the oldest file and process each of them as follows:
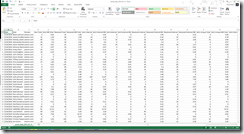
Hide columns C through E and H through to O and R through to U:
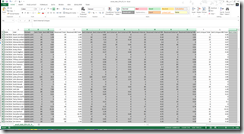
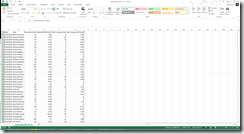
You now have a spreadsheet with Date/User/Received Total/Received MB Total/Sent Unique Total/Sent Unique MB Total:
Format as a table by selecting a cell in the table and clicking the Table button in the Insert tab:
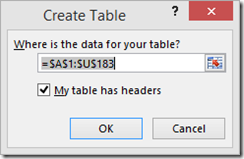
The Table Tools / Design tab appears. Select Total Row check box from here. This will scroll you to the bottom of the table.
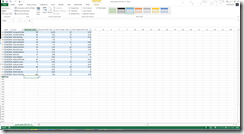
Select the third cell in the total row and drop-down the options and choose Average:
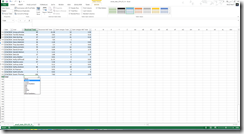
Drag this Average cell formula across all the four columns of numbers:
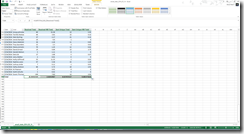
Modify the fourth column (Received MB Total) to read as follows =SUBTOTAL(101,[Received MB Total])/Table1[[#Totals],[Received Total]]*1024. This is the fourth column divided by the third column (the count of received messages) and multiplied by 1024 to convert it from MB to KB. The Exchange Bandwidth Calculator and Storage Calculator work on values in KB and not MB.

Repeat for the fourth column of figures. This time take the formula to be =SUBTOTAL(101,[Sent Unique MB Total])/Table1[[#Totals],[Sent Unique Total]]*1024 which is the last column divided by the previous and converted to KB. This total row now shows you the average messages sent and received and the average size of these messages in KB.
At the bottom of the spreadsheet add the following:
- Sent/Mailbox/Day
- Received/Mailbox/Day
- Average/MessageSize/Day (KB)
Then copy the relevant data into the cells as shown The Average is the sum of the two averages divided by 2 (=Table1[[#Totals],[Received MB Total]]+Table1[[#Totals],[Sent Unique MB Total]]/2):
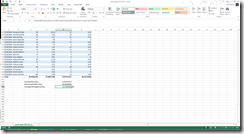
Then take all your numbers and reduce the number of decimal points shown:
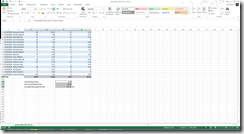
Now that you have the raw data calculated, save this file as an Excel Workbook (and not a CSV).
Repeat for each of the CSV files you have available
Process The Daily Data
Create a new spreadsheet that contains the following three tables:
- Messages Sent Per Day, with a row for each day and a column for each unique geographical region
- Messages Received Per Day, with a row for each day and a column for each unique geographical region
- Average Message Size (KB), with a row for each day and a column for each unique geographical region
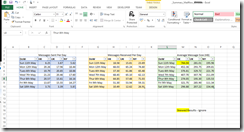
This will look like the following, once all the data is copied from the source spreadsheets:
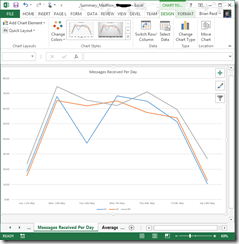
Now you can create a chart for each region for each table. The following shows Sent / Received and Average (KB). Each region is overlapping as a different line colour:
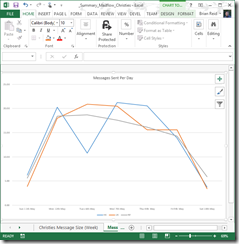
Note its possible here that HK (blue) is missing some data as it is unexpectedly low
Note the HK (blue) Sunday Average message size. This is probably becuase one or a few users sent a disproportionate number of larger emails on the quiet day of the week. For my analysis I am going to ignore it.
Now I have my peak Messages Sent Per Day for each region – and I take the highest value for the week and not the value for yesterday which is what I would get if I just ran the above script once.
This data can now go into the Bandwidth Calculator and generate accurate figures for the business in question.

Leave a Reply